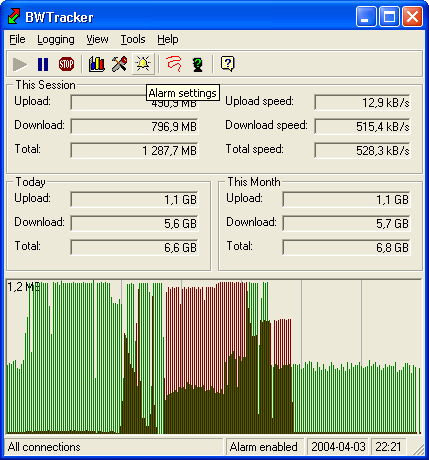
| Main display |
 |
The icon shortcuts is just a simpler way of reaching common function, which all can be reached with the menu. When the chart is clicked it will resize to fill the whole window. Another click will change it back to normal view.
|
| Settings dialog |
|
The settings dialog consists of four different tabs, which are all described below:
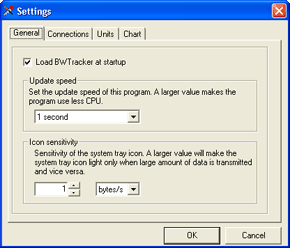 If the "Load BWTracker at startup" is checked, there will be a string set in the Windows registry which will load BWTracker at Windows startup. The update speed changes the interval between every update in the main display. Choose a larger value if you are not interested in the exact values of if you are experience difficulties caused by a high CPU usage by BWTracker. The icon sensitivity may be changed to only indicate high values of download or upload. An even better way of be notified when a high upload is present is to setup an alarm.
|
|
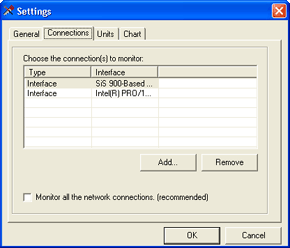 This is where you specify what BWTracker should monitor. You may choose interfaces (such as an Ethernet card), IP-numbers or ranges there of). But the preferred way of monitoring is to check the "Monitor all the network connections". However, this does not monitor the TCP loopback interface at IP 127.0.0.1.
|
| |
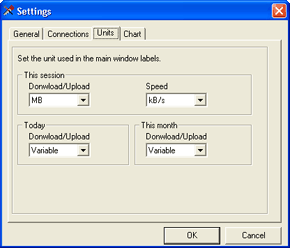 Choose the preferred way of showing the current amounts of data transferred in the main display. The "Variable" choice chooses the appropriate units individually.
|
|
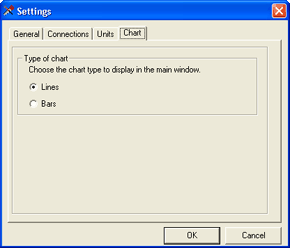 The chart in the main display may be viewed in two ways: Lines or Bars.
|
|
| Connections dialog |
|
|
Display all the TCP and UDP connections. The addresses 0.0.0.0 and 127.0.0.1 are seldom of interest, so they can be filtered out with a checkbox.
|
| Interface Info dialog |
|
|
Show all the Interface information that is available. If you do not understand all the acronyms, you probably do not need the information either.
|
| Logs dialog |
|
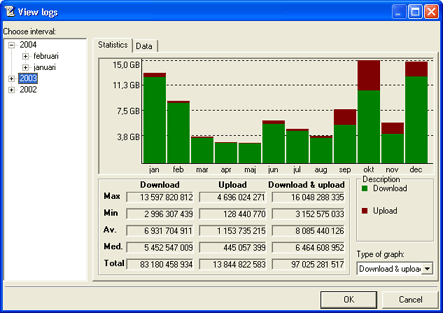 This tab shows statistics about all your logs. You may choose to view statistics for a whole year, a month or a day. The values in the bottom are explained below. The values have somewhat different meaning depending on if the selected item in the tree menu is a year, month or day.
| |
General description |
Year |
Month |
Day |
| Max |
The hightest amount of data transferred. |
This shows the month that has the highest sum. |
This shows the day that has the highest sum. |
This shows the log that has the highest value. |
| Min |
The lowest amount if data transferred. |
This shows the month that has the lowest sum. |
This shows the day that has the lowest sum. |
This shows the log that has the lowest value. |
| Av |
The average value. |
The average of all the months. |
The average of all the days in the chosen month. |
The average of all the logs the chosen day. |
| Med |
The median value. |
The median value of all the months. |
The median day of all the days in the chosen month. |
The median log of all the logs in hte chosen day. |
| Total |
The sum. |
The sum of all logs made the selected year. |
The sum of all logs made the selected month. |
The sum of all logs made the selected day. |
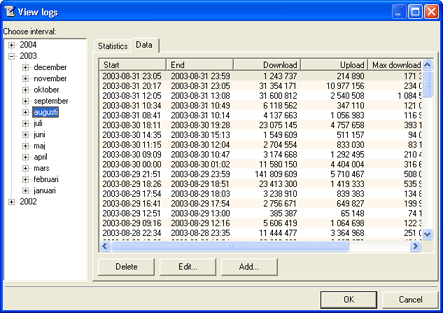 Here you may view and edit all the logs. The logs may also be sorted by clicking on the headers in the list.
|
| Traceroute dialog |
|
|
Perform a traceroute to a specific host name or IP. You may also change the way the traceroute is performed. Change these values only if you know what you are doing.
|
| Whois dialog |
|
|
Perform a whois request for a specific host name or IP. You may also change the whois server. The selected server works best with domains in Europe. A tip is to find a server which deals with domains near you.
|
| Alarm dialog |
|
|
Specify all the alarm you need. There are practically no limits for how the alarms are setup. Once an alarm is triggered, an alarm window is displayed which notifies you about which alarm is triggered. You may also choose a sound file to play when the alarm window is displayed.
|
| Register dialog |
|
This window allows you to register your copy of DJ DeLuxe.
* Please read the license agreements before fulfilling the registration. The name together with the unique license key should have been received from Daniel Lind.
|